

Latest CBO Report Shows Political Will Is Needed to Tackle Unsustainable Debt
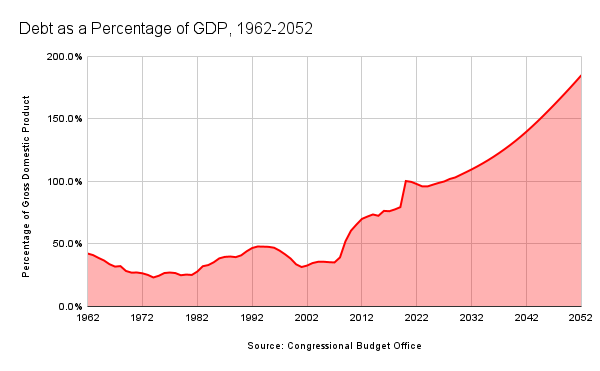
Debt Is Projected to Reach 185 Percent of GDP

Last week, the Congressional Budget Office (CBO) released the latest iteration of its annual Long-Term Budget Outlook. The report builds on the ten-year budget projections outlined in The Budget and Economic Outlook, the most recent of which was released in May, by looking at budget projection through FY 2052. Although there’s uncertainty when taking a look a budget numbers this far in advance, the report does give Congress an idea of what expect, particularly as the United States’ population grows older, begins retiring, and enrolls into federal retirement and healthcare programs.
Starting with a historical baseline, below are the averages of three important budgetary data points between FY 1962 and FY 2021 as percentages of gross domestic product (GDP).
Revenues: 17.3 percent
Outlays: 20.4 percent
Deficit: -3.1 percent
During this 60-year period, the high point for revenues was 20.0 percent of GDP in FY 2000. Although there were years covered in the average in which statutory tax rates were substantially higher, the economy in FY 2000 was very productive, and the unemployment rate dipped as low as 3.8 percent.
Outlays reached as high as 31.3 percent of GDP in FY 2020 and 30.5 percent in FY 2021. This is outside the norm, but it’s outside the norm because of the congressional response to the COVID-19 pandemic. Looking back to the Great Recession and its aftermath (FY 2008-FY 2012), outlays reached as high as 24.3. Obviously, the deficit hit a post-World War II high point in FY 2020 at 15.0 percent.

What do we mean when discussing revenues and outlays? Revenues consists of individual incomes taxes, corporate income taxes, payroll taxes, and other smaller revenue sources. Outlays are discretionary spending (defense and nondefense), mandatory spending (Social Security, Medicare, Medicaid, etc.), and net interest (interest payments on the public’s share of the national debt).
The CBO latest report shows that revenues will slowly begin to exceed historical averages over the next 30 years. Outlays, too, will exceed historical averages as federal entitlement programs—particularly Social Security and Medicare—begin to grow as the population begins to retire. Because of this growth in outlays, budget deficits will begin to grow, as will the cost of servicing the share of the debt held by the public.

As you can see, federal revenues will grow and exceed the historical average. Of course, the individual tax reforms, including the lower statutory tax rates, under the Tax Cuts and Jobs Act will expire at the end of CY 2025. It’s worth noting that revenues in FY 2022 and FY 2023 are projected to be 19.6 percent and 18.6 percent, but inflation may play a role in that. Revenues are projected to remain historically high as a percentage of GDP.
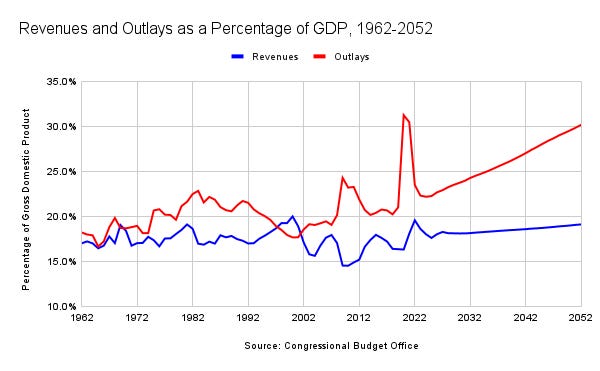
Outlays, though, will grow. Discretionary spending is projected to decline as mandatory spending and net interest grow and consume larger shares of outlays. CBO didn’t specifically project discretionary spending in the Long-Term Budget Outlook, so the data below come from The Budget and Economic Outlook.

The growth in mandatory spending comes almost entirely from Social Security and Medicare, which will grow from 7.8 percent of GDP in FY 2022 to 12.2 percent of GDP in FY 2052.

Net-interest is impacted by interest rate increases. When the Federal Reserve increases interest rates, the cost of servicing the public’s share of the national debt will grow. You can see the impact in the report, as the cost of servicing the share of the debt held by the public as a percentage of GDP is projected to skyrocket over the next 30 years. Outlays for net interest are projected to exceed defense discretionary spending by in FY 2030.

Obviously, with the growth of outlays for mandatory programs and net interest projected to outpace the growth of revenues, the deficit will rise. Although the deficit is projected to decline to 3.7 percent of GDP in FY 2023, it will rise to 11.1 percent in FY 2052.

The share of the national debt held by the public has exploded since the Great Recession. In FY 2007, the share of the debt held by the public was 35.2 percent. By FY 2012, it was 70.0 percent. The economic contraction and deficit spending caused by the reaction to the COVID-19 pandemic caused the share of the debt held by the public to hit 100.3 percent of GDP in FY 2020. However, as the economy recovered, it’s projected to dip back to 97.9 percent, but this is only temporary.
Because the deficit is projected to rise, the share of the debt held by the public is expected to rise to 185.0 percent of GDP in FY 2052. That level of debt isn’t sustainable, and it will have a negative impact on the economy, dragging on growth.
Of course, there are ways to address these fiscal issues, but they all work in tandem. Some will say increasing tax rates is part of the solution, but that hurts growth. Some will say Modern Monetary Theory is the answer, but we’ve dabbled with that before, and it hurt growth because of high interest rates.
Reforming entitlements for future beneficiaries while preserving benefits for those in the system is an immediate need. The longer Congress kicks this can down the road, the more painful it will be. That said, governing by crisis is what Congress does. The adoption of a Swiss-style debt break, like the Maximizing America’s Prosperity Act would do, is also needed.
The problem is fixable, but the political will needs to exist in Congress. Right now, only a few actually see the problem and want to address it.